Strand7 Software: In Detail: Results: XY Plots
Investigating results in Strand7
|
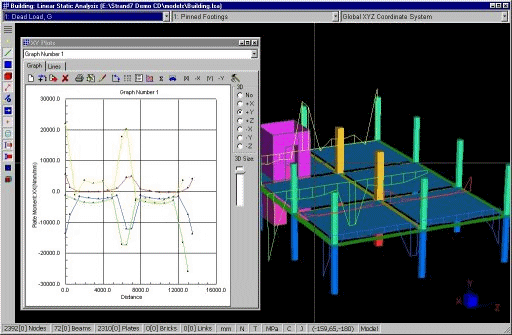
XY plots You can generate an XY plot of virtually any result parameter between two points on the model. Simply click on two nodes to specify the desired path - the path can cut across elements. You can also superimpose the graph onto the model by selecting a 3D plot direction. |

|
Legends are automatically generated for the graphs. You can also integrate the plotted quantities. For example, the integral of a stress resultant along a path gives the total force transmitted across the path. Moment integrals are also given. Graphs can be previewed and printed via the print previewer, similarly to the spreadsheet printing. |
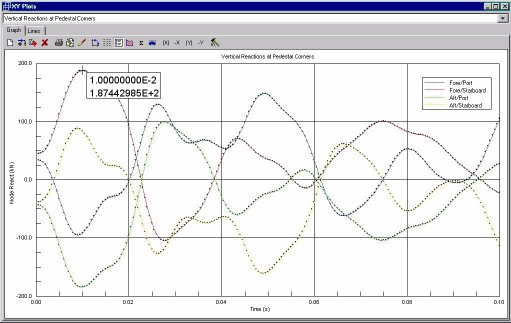
To find the values at any point on the graph, simply point. |

|

 Menu
Menu