Strand7 Software: In Detail: Composites: Post Processing
Laminated composites capabilities
| Strand7 may be used for the analysis of laminated composites via dedicated pre processing, solver and post processing modules. Both symmetric and unsymmetric laminated composites are supported. |
|
|
Post ProcessingContouringAny quantity that is calculated may be contoured, including: |
|
| Ply reserve factors may also be contoured, including: |
|
|
When contouring the ply based results, you have the option of selecting a specific ply, the ply with the minimum or maximum value, or the plies on the laminate surface. Options are also available for the selection of the best element smoothing and extrapolation strategies. |
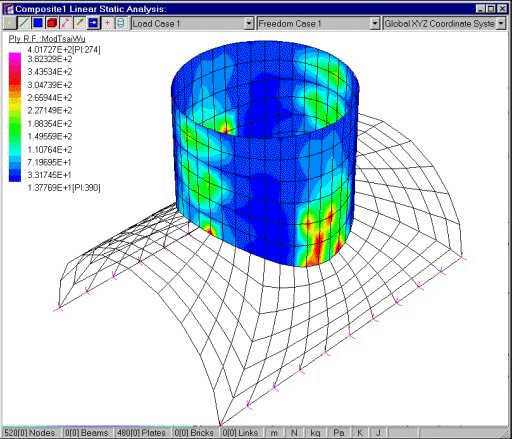
The following figure shows a contour of maximum Modified Tsai-Wu Reserve factors. Plates drawn as wireframe are not composites so the contour is not shown. |
|
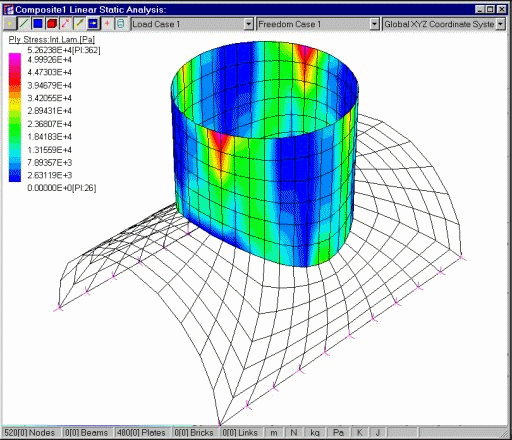
The following figure shows a contour of Maximum Interlamina Shear Stress on each plate. This contour shows the maximum value within the laminate and avoids having to check each ply individually. Plates drawn as wireframe are not composites so the contour is not shown. |
|
|
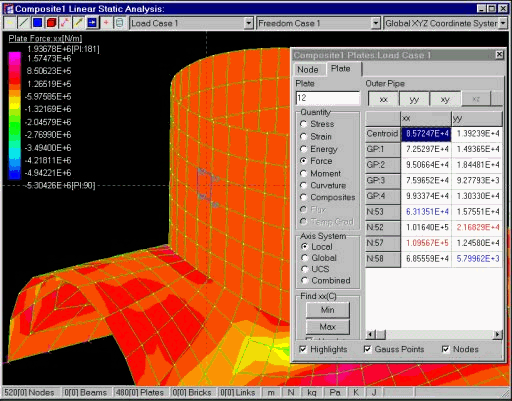
You can also "Peek" at an individual element to inspect fully the load, state of stress or reserve factors. These quantities are available at the centroid, the Gauss points and the nodes. Colour coding of values in the peek dialog box allows quick inspection of the maximum and minimum values on the element - red is max, blue is min. To find a specific minimum or maximum value, you can click the Min/Max buttons and Strand7 will identify the element based on your selection criteria: for example, you can find the element which has the maximum Gauss Point Sxx. |
 |
|
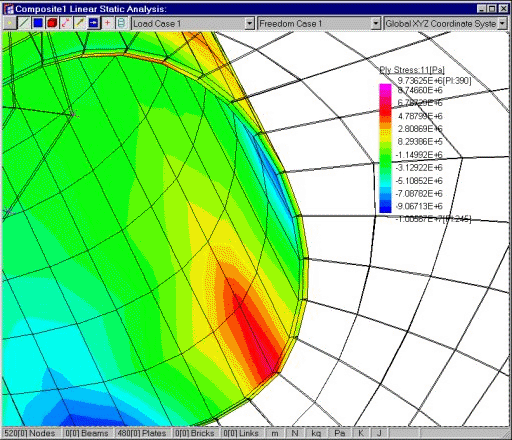
To investigate the results on the outer surface of the element, plates may be rendered with thickness (similar to a brick). It means that you need not specify the ply number, and is particularly useful for models containing laminates with different numbers of plies. Note that in the figure we can see how the contour varies through the plate's thickness. |
|
|
It is also possible to draw graphs of selected quantities, along an arbitrary path on the model. The path need not be along a line of nodes; values are interpolated at intermediate positions wherever the cutting line bisects elements. The following figure shows the 2D graph together with a corresponding 3D representation plotted on the model. |

|
Complete listings of the results data can be obtained via the Result Listings spreadsheet. Data can be sorted and filtered in a number of ways, on a particular column or result value. |
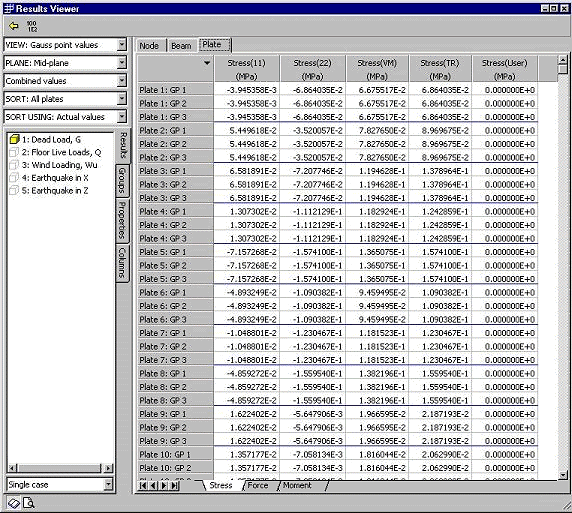
|
Listings can be automatically printed in a configurable report format (not just a list of numbers), or copied and pasted directly to the Windows clipboard for further use by other applications. | |

| |
Professional reports can be easily generated with the aid of Strand7's built in report creator. Reports can be customised with company logo and other details. The figure above shows Strand7's print previewer. | |
|
For more information on laminate/composite material applications, see Strand7 Webnotes - Applications / Composites. | |

 Menu
Menu